Deploy and Scale your Dask Cluster with Kubernetes
May 18, 2020
Dask is a parallel computing library for Python. I think of it as being like MPI without actually having to write MPI code, which I greatly appreciate!
Dask natively scales Python
Dask provides advanced parallelism for analytics, enabling performance at scale for the tools you love
https://dask.org
One of the cooler aspects of Dask is that you scale across computers/servers/nodes/pods/container/etc. This is why I say it's like MPI.
What we'll be talking about today are:
- Advantages to using Kubernetes
- Disadvantages to using Kubernetes
- Install the Dask Helm Chart
- Scale your Dask Workers Up / Down with
kubectl scale - Modify the Dask Helm Chart to add Extra Packages
- Autoscale your Dask Workers with Horizontal Pod AutoScalers
Benfits to Dask on Kubernetes
Let's talk about some of the (many!) benefits to using Kubernetes!
Customizable Configuration
Another very important aspect of Dask, at least for me, is that I can set it up so that the infrastructure side of things is completely transparent to the user, and they never have to touch it. This speaks to me because traditionally I have been on the DevOps and infrastructure side of the tech problem equation, and working with data scientists who on the application or model development side.
I like having the level of flexibility where I can get a nice default setup on the infrastructure side, and then the users that care about customization can tweak as needed on the application side.
Let's take a real world example. I am working on a team with a data scientist who is creating a Dash web application that does real time visualization of some dataset.
The idea is that a user clicks a button, and in the background numbers are crunched, model parameters are evaluated, and science moves forward!
We don't want to crunch them in the browser, or even on a single server, because have you seen bioinformatics datasets? Datasets are constantly getting larger and higher in resolutions. (Ok rant over for now.)
Ideally, what we want is to crunch numbers on a distributed, auto scaling compute environment that is completely independent of our web application. That is where Dask comes in!
Ability to integrate
You are rarely every using just one tool or system. The most common use case I see is something like:
- Data is stored on a networked filesystem or S3
- Exploratory analysis is done on JupyterHub, RStudio, or an HPC compute cluster with just SSH
- Final analysis is put into a pipeline tool such as Apache Airflow, with tasks being run on Kubernetes or a job queue system such as AWS Batch.
Each of these can be considered an individual component, and using something like Terraform you can easily deploy your file systems, applications, and clusters.
Then there is integrations with the Dask package itself. Dask can be used as a drop in replacement for many SKLearn functions using the dask_ml library.
Ability to Auto Scale
Then, of course, we don't want to pay to have a bunch of servers just lying around doing absolutely nothing. That's why we're on the cloud! If you use Dask on Kubernetes you can either scale manually, or you can scale as the need arises by creating auto scaling rules in your Kubernetes configuration.
Dask will pay attention to when the works go up or down and take advantage of this all under the hood without you having to do anything besides point it to a scheduler!
Disadvantages to Dask on Kubernetes
You'll have to learn Kubernetes, and have at least a basic understanding of how Docker containers work. If you don't have either of these you have a fairly steep learning curve.
Technologies Used
For this tutorial you will need to have kubectl and helm installed.
You'll need some manner of Kubernetes or MiniKube cluster. Kubernetes is meant to be platform agnostic, so it doesn't matter if you are deploying on AWS, GCP, or in house.
If you're interested in how I deploy my AWS EKS clusters you can check out this blog post I wrote.
From there we'll use Helm V3, which is a sort of package manager for applications on Kubernetes, to deploy our Dask Cluster.
Install Dask
You should, at this point, have your Kubernetes or MiniKube cluster up and running.
The only difference we care about with our Kubernetes/MiniKube setup is exposing the services. If you're using a cloud provider such as AWS, you'll want to deploy using a LoadBalancer serviceType. If you're using on site or MiniKube you'll need to deploy using a NodePort and then use kubectl to port forward the address. If you're using Minikube this is the best comprehensive resource I've found for exposing services.
For this first pass we're just going to be installing Dask and having a look around. Then we will do some cool autoscaling things!
We're going to be using the official Dask Helm Chart.
helm repo add dask https://helm.dask.org/
helm repo update
# Kubernetes cluster on a cloud provider (AWS, GCP, Azure)
# The default serviceType is already set as LoadBalancer
# Make sure to remember your release names!
export RELEASE="dask"
helm install ${RELEASE} dask/dask
# Kubernetes cluster on an in house server/minikube
# helm install dask dask/dask --set serviceType=NodePort
You'll notice that when you install a chart with Helm there will be some very handy instructions that pop up. If you ever need to access these again and don't want to spend the rest of your life scrolling around, run the command helm status $RELEASE with the release name you supplied earlier, in this case dask.
These may take a few minutes to come up, but let's run some commands.
kubectl get pods |grep dask
kubectl get svc |grep dask
You should see one or more pods in either a state like Init or Running. It takes a few minutes to get up and running, so go and get some tea!

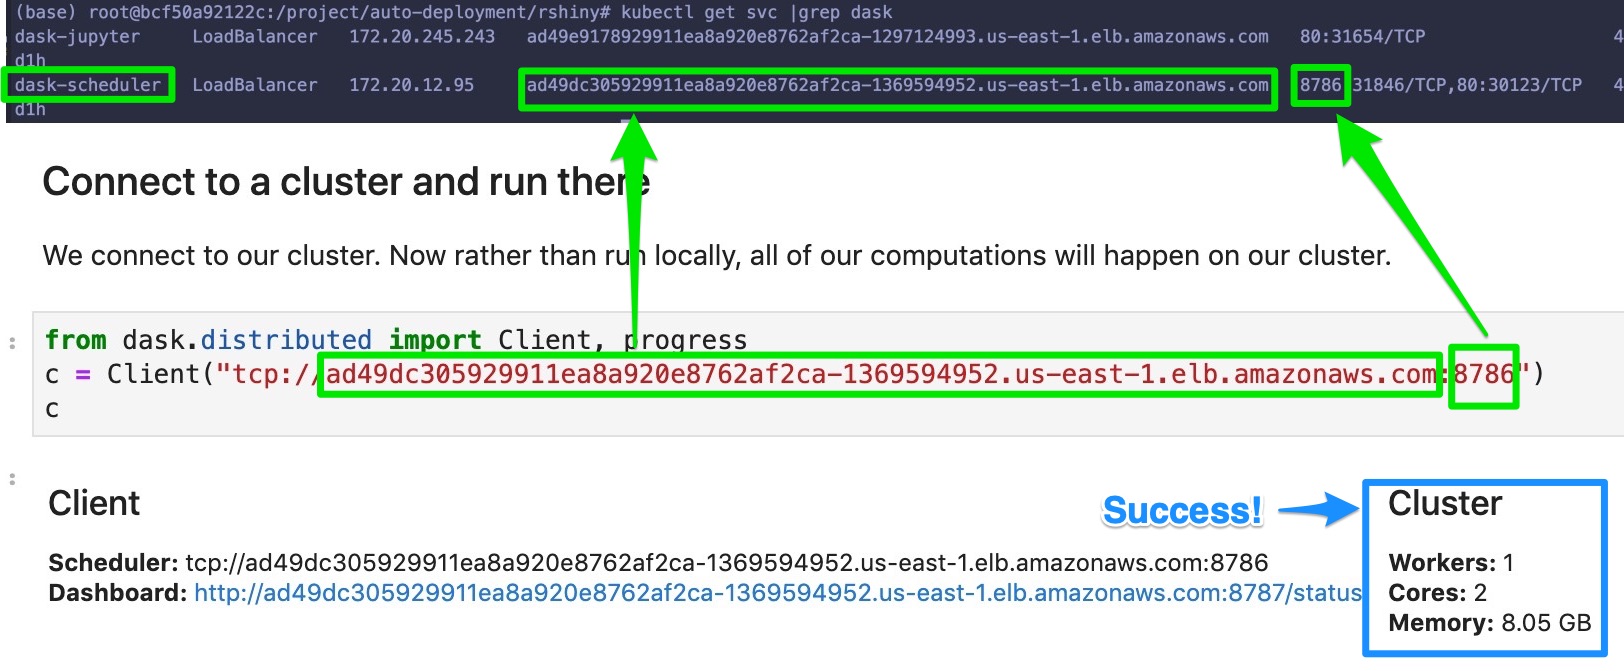
If you're on a cloud provider you'll see a LoadBalancer service for your Jupyter notebook and the Dask Scheduler. If you're using MiniKube you'll have to run the MiniKube command to get the service URL.
Explore our JupyterHub Environment
Now, we have Jupyterhub, which is very handy because it gives us a python console and a terminal.
Head on over to the url displayed in the dask-jupyter svc.
kubectl get svc dask-jupyter
# Or if you can't remember the name of all the services just grep for your release name
# kubectl get svc |grep dask
The default password is dask. If you'd like to change it go and check out the dask helm chart docs.
On the left hand side you'll see the File Browser. Go over to examples/01-custom-delayed.ipynb. Start running through the code cells until you hit the dask client.
Configure the Dask Client
Now, this is one of those things that really trips people up. And by people I also mean me when I was learning Docker. ;-)
You can (generally) access services in one of two ways. If you're internal to the cluster, like we are on the Jupyterhub Notebook, you can use the service name, in this case dask-scheduler, because networking magic. We also have an external IP address, so we're going to use that. You could use either, and it works fine. It's probably better to use the service name because the IP address can change, but I wanted to demonstrate that it works with the external IP here too.
Don't forget the tcp in front of the IP address. That one gets me all the time!

Press the run button and you should see some information about the Dask Cluster come up!
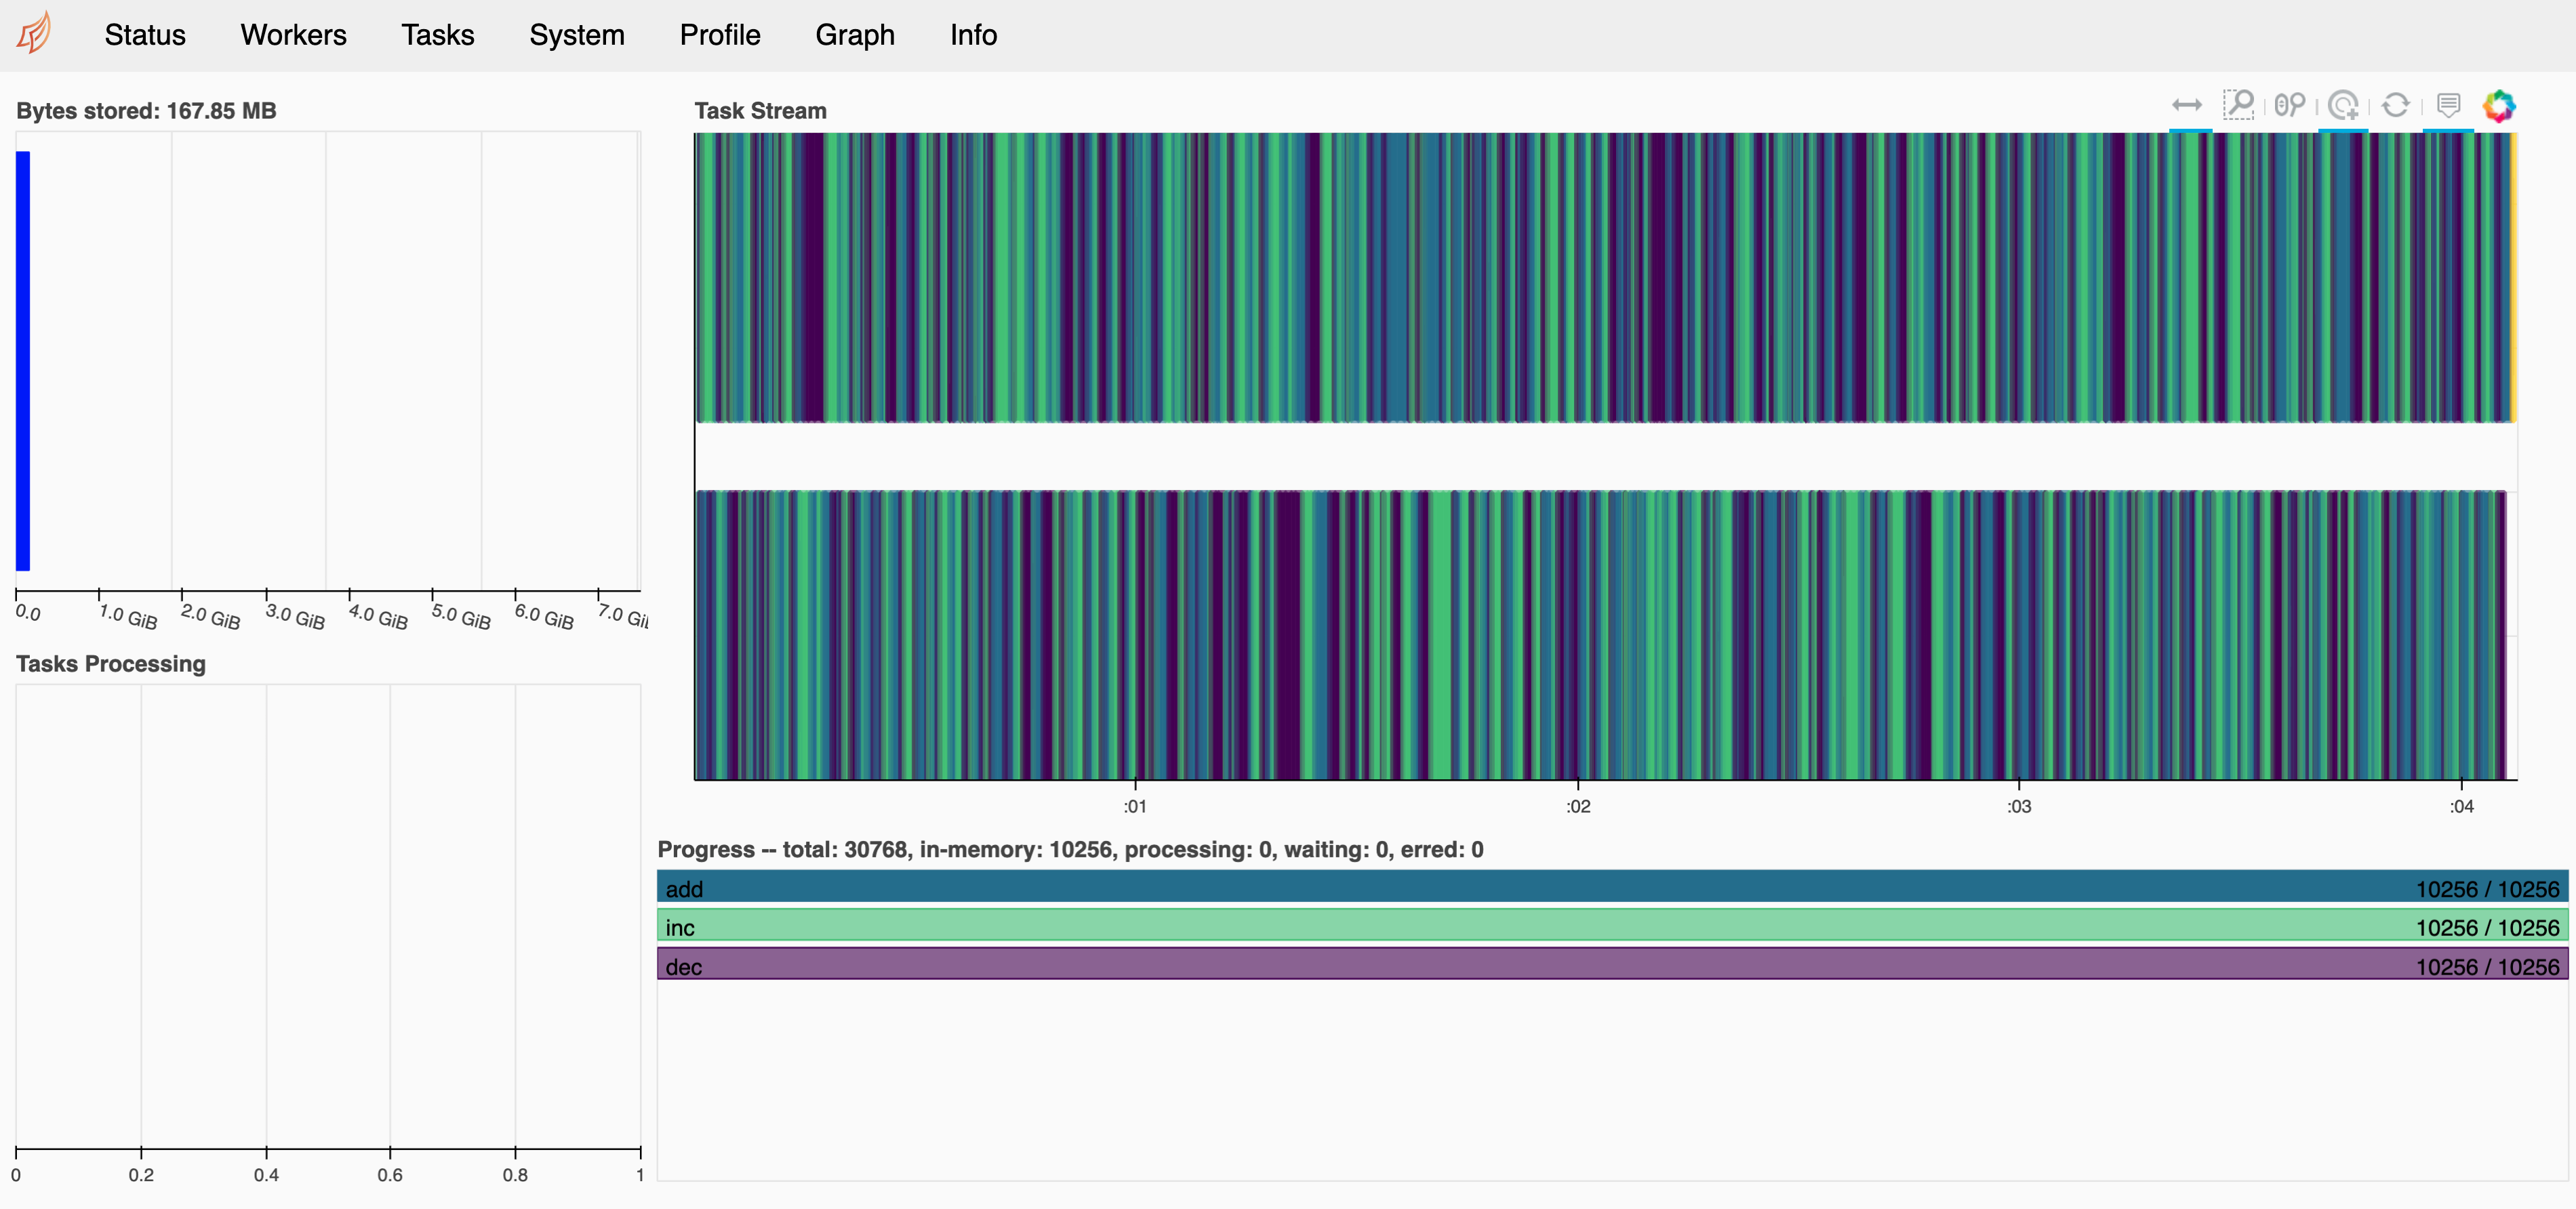
Run through the rest of the cells so we have something interesting to look at on the Dask Status Dashboard.
Explore The Dask Dashboard
Head back over to your svcs.
kubectl get svc dask-schedulerAnd get the External IP. Open up that web address, with or without port 80 (the default port of any site is port 80, so you don't need to put it), and check out the Dask Dashboard.
from dask.distributed import Client, progress
import dask
import distributed
dask.config.set({
"distributed.comm.timeouts.tcp": "50s",
"distributed.scheduler.allowed-failures": 999
})
c = Client("tcp://dask-scheduler:8786")
# c = Client("tcp://EXTERNAL_IP:8786")
c

# TRUST BUT VERIFY
dask.config.get('distributed.comm.timeouts')
dask.config.get('distributed.scheduler.allowed-failures')
Dask Status
This is the default portion of the dashboard. If you ran through the rest of the cells you should see something here.
If you want to play around a bit check out the functions that are actually executed with Dask and change their parameters.
%%time
zs = []
# Change the range value to see how it affects tasks
for i in range(10000):
    x = inc(i)
    y = dec(x)
    z = add(x, y)
    zs.append(z)

zs = dask.persist(*zs)
total = dask.delayed(sum)(zs)
Scale the Dask Workers
Now that we've done our baseline checks to make sure everything is working, let's change around the number of dask workers. I did this for two reasons. I wanted to make sure this wouldn't make the Dask Scheduler freak out. Then, I wanted to set the foundations for autoscaling, or scaling based on demand!
In order to do this we will use the kubectl scale command. Exactly what we scale is based on the Kubernetes Type, which is normally Deployment, StatefulSet, or SVC. For more information check out the kubectl cheatsheet and scaling an deployment.
Our Dask Worker is a Deployment, so we will use the Deployment scaling strategy. If you don't know what you are scaling, go to the helm chart, and then go to the template for the thing you want to scale.
Here is the dask-worker template.

Let's scale our worker to 4 replicas!
kubectl scale deployment.v1.apps/dask-worker --replicas=4 You should see a success message:
deployment.apps/dask-worker scaledGet the pods and you should see the dask-worker pods either up or initializing!
(base) root@6e0a2f79446d:~# kubectl get pods |grep dask
dask-jupyter-6596ccb45f-2cl64     1/1     Running   0          6d23h
dask-scheduler-689c44ccf7-c6j58   1/1     Running   0          6d23h
dask-worker-7df97cb9d-bvkhm       1/1     Running   0          6d23h
dask-worker-7df97cb9d-dwq45       1/1     Running   0          7m55s
dask-worker-7df97cb9d-k7xdb       1/1     Running   0          43s
dask-worker-7df97cb9d-qvkl6       1/1     Running   0          7m55s
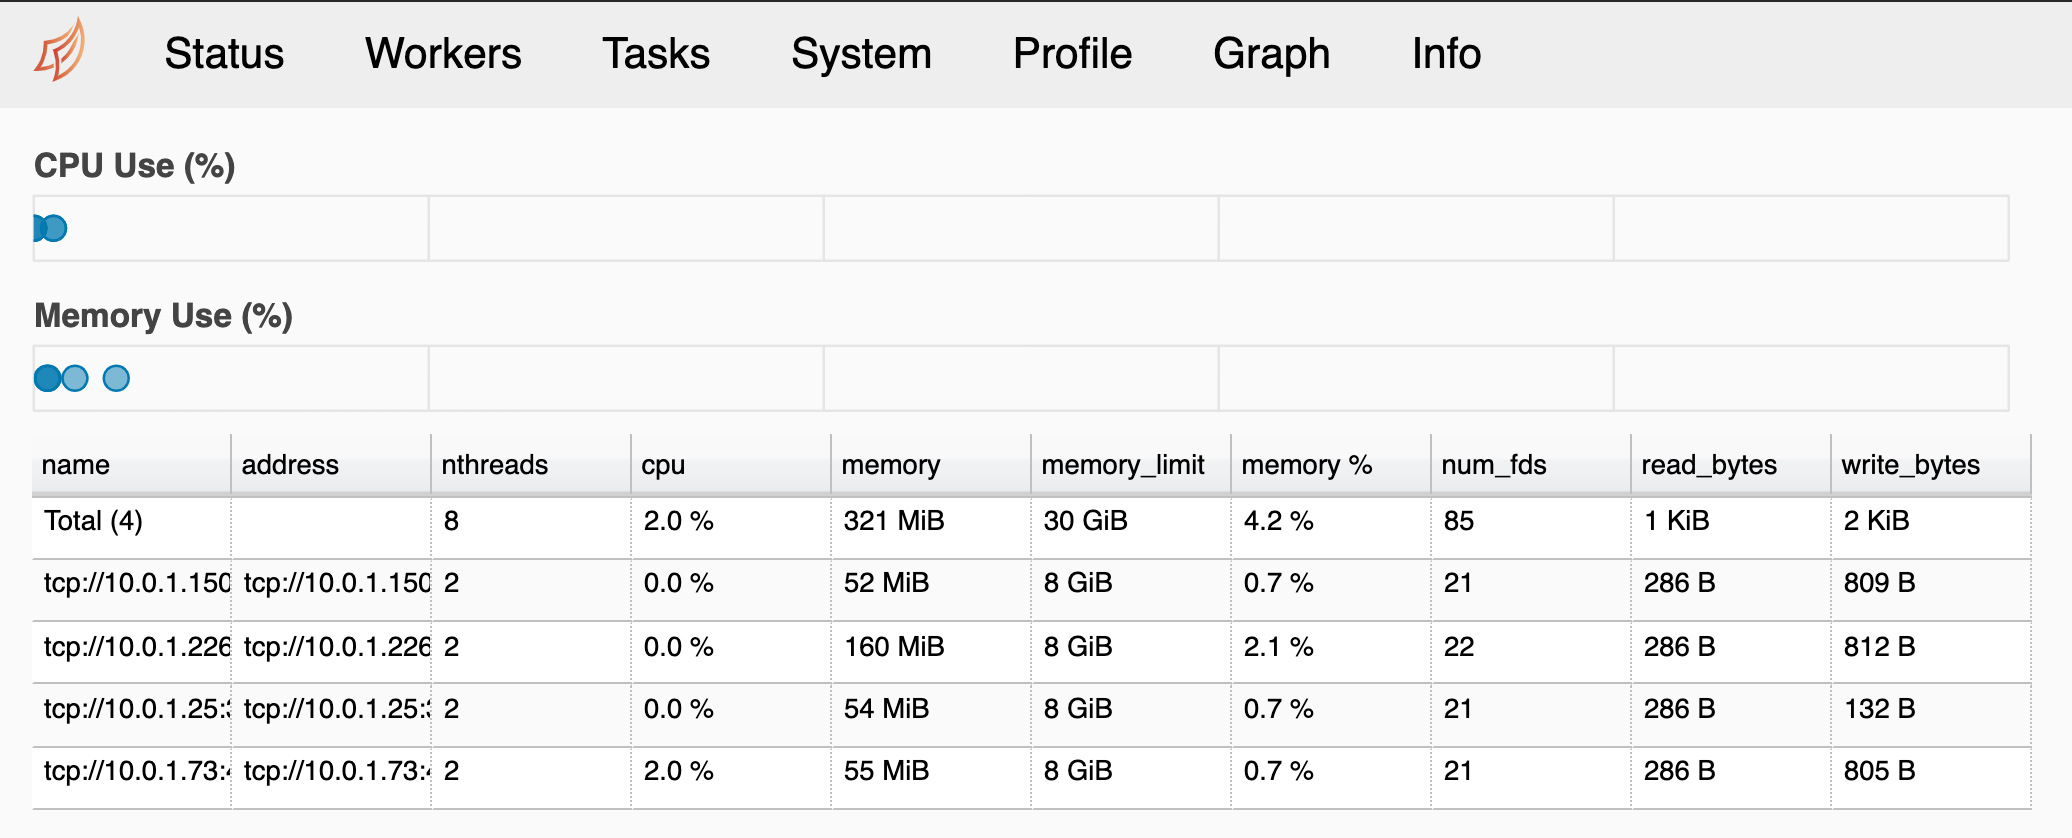
You can head on over to the Dask Dashboard -> Workers, and you should see 4 workers!

To get ready for the next section, let's scale our workers down to 1 replica.
kubectl scale deployment.v1.apps/dask-worker --replicas=1 Autoscale the Dask Workers
This next section is completely optional. It describes how to AutoScale your Dask workers to dynamically scale up or down based on demand. This is an advanced topic, and the exact numbers are based very much on your own Kubernetes cluster and scenario.
First you will need to install the helm metrics server .
helm repo add stable https://kubernetes-charts.storage.googleapis.com
helm repo update
helm install metrics stable/metrics-server
Warning it is incredibly easy to clobber your system while doing this. Do not play around with autoscaling on a production system!
If you clobber your installation, most often in the form of getting one of your pods Evicted, the easiest thing to do is to just delete your release with helm delete dask and then reinstall with helm install dask dask/dask.
Earlier we went over Scaling. Scaling is cool, but its not quite hands off enough for what we want. What we really want is to have autoscaling, which means that we scale based on demand!
kubectl scale deployment.v1.apps/dask-worker --replicas=1
kubectl autoscale deployment.v1.apps/dask-worker --min=1 --max=3 --cpu-percent=1
This will add a Horizontal Pod Autoscaler.
kubectl get hpa
# To delete it run
# kubectl delete hpa dask-worker
Update our Dask Deployment with Dask-ML
Now, to make this example more interesting, let's update our Deployments to add the dask-ml libraries.
Make sure that before you do this that you have exported any work you care about! This will recreate all the containers!
wget https://raw.githubusercontent.com/dask/helm-chart/master/dask/values.yamlOpen up the values.yaml and look for the worker -> env key. Change the EXTRA_CONDA_PACKAGES environmental variable to include dask-ml and matplotlib:
worker:
  name: worker
  image:
    repository: "daskdev/dask"
    tag: 2.14.0
    pullPolicy: IfNotPresent
    # dask_worker: "dask-cuda-worker"
    dask_worker: "dask-worker"
    pullSecrets:
    #  - name: regcred
  replicas: 3
  default_resources:  # overwritten by resource limits if they exist
    cpu: 1
    memory: "4GiB"
  env:
  #  - name: EXTRA_APT_PACKAGES
  #    value: build-essential openssl
  #  - name: EXTRA_CONDA_PACKAGES
  #    value: numba xarray -c conda-forge
  #  - name: EXTRA_PIP_PACKAGES
  #    value: s3fs dask-ml --upgrade
To:
worker:
  name: worker
  image:
    repository: "daskdev/dask"
    tag: 2.14.0
    pullPolicy: IfNotPresent
    # dask_worker: "dask-cuda-worker"
    dask_worker: "dask-worker"
    pullSecrets:
    #  - name: regcred
  replicas: 3
  default_resources:  # overwritten by resource limits if they exist
    cpu: 1
    memory: "4GiB"
  env:
  #  - name: EXTRA_APT_PACKAGES
  #    value: build-essential openssl
  ### ADD IN EXTRA PACKAGES HERE!
    - name: EXTRA_CONDA_PACKAGES
      value: numba xarray dask-ml matplotlib -c conda-forge
  #  - name: EXTRA_PIP_PACKAGES
  #    value: s3fs dask-ml --upgrade
Do the same thing with the jupyterhub variables!
Now update the installation with:
helm upgrade --install dask dask/dask --values values.yaml Go and take a look to see how your pods are doing:
kubectl get pods |grep daskYou may see something saying "Container Creating" or "Init something", and that is because by default Kubernetes does a rolling update, where it doesn't actually update your pods until the next one is ready.

Refresh your Jupyterhub page and log back in with the password dask.
Open up the examples/ml/incremental.ipynb notebook.
Make sure to change your Client configuration!
from dask.distributed import Client, progress
import dask
import distributed
dask.config.set({
"distributed.comm.timeouts.tcp": "50s",
"distributed.scheduler.allowed-failures": 999
})
c = Client("tcp://dask-scheduler:8786")
Run through the cells until you get to "Create a Random Dataset".
You will see some code that looks somewhat like this, except with different numbers for n_samples and n_features.
What you want to do is to change these to very small numbers, just to test out with and not risk clobbering your entire system.
I started off with n_samples=100 and n_features=2. Just play around with it!
n_samples = 100
n_features = 2

# These were my final numbers to get anything interesting with the autoscaling
# n_samples = 10000000
# n_features = 500
chunks = n_samples // 50

X, y = dask_ml.datasets.make_classification(
        n_samples=n_samples, n_features=n_features,
        chunks=chunks,
        random_state=0
)
Now you can run through the code until you get to Create a Scikit-Learn Model, SGDClassifier and the %time block.
%time _ = inc.fit(X_train, y_train, classes=[0, 1])This, here, is where the dask magic happens! Run through the whole code with your small numbers. Then gradually increase to see how it affects the autoscaler.
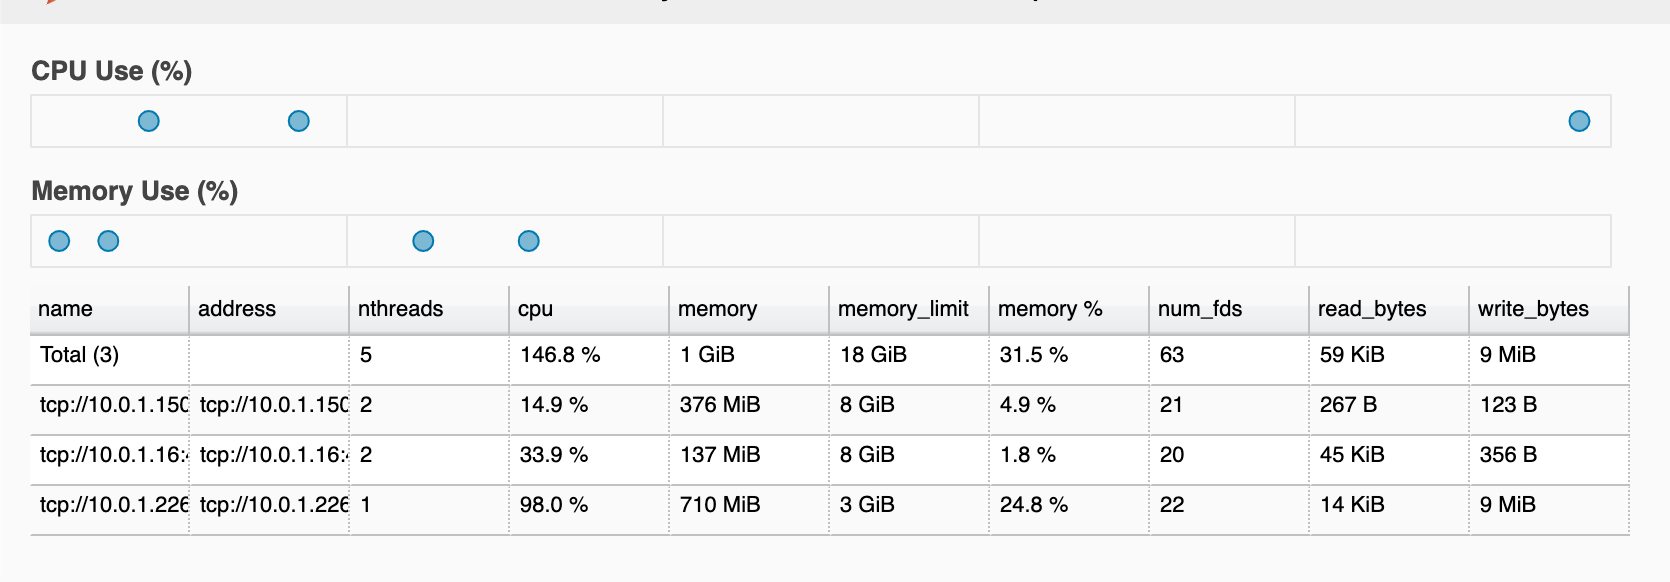
You can check out the autoscaler a few different ways. One is to go to the Workers portion of your Dask Dashboard. The other is to just run watch kubectl get pods.
When exactly your pods will scale depends upon the amount of CPU/memory available to your Kubernetes cluster and individual containers. I tried to put it at a very low amount so that everyone can see the autoscaling in action, but you will have to play around quite a bit with the n_samples and n_features to take up enough CPU and memory to scale your pods.
Here are some pods in the pending state:

And here they are getting registered by the Dask Scheduler!

Troubleshooting Evicted
If your pods keep coming up as 'Evicted' it means you are trying to schedule things there aren't resources for in your cluster. You can go to the values.yaml and play around with the various resources keys to request smaller containers.
It's really just one of those things that you need to play around with, until you get the exact settings.
Troubleshooting
# Get your dask-worker pod names
kubectl get pods |grep dask-worker

# Get various metrics and logs
kubectl logs pod-name
kubectl describe pod pod-name
kubectl top pod pod-name
Wrap Up
That's it! I hope you found this post helpful! If you have any questions or would like to request a tutorial please don't hesitate to reach out to me at [email protected].
Docs and Resources
Kubernetes Horizontal Scaling Pods

